
Written by Student Reporter, Evita Sonny (Management 2020)
-
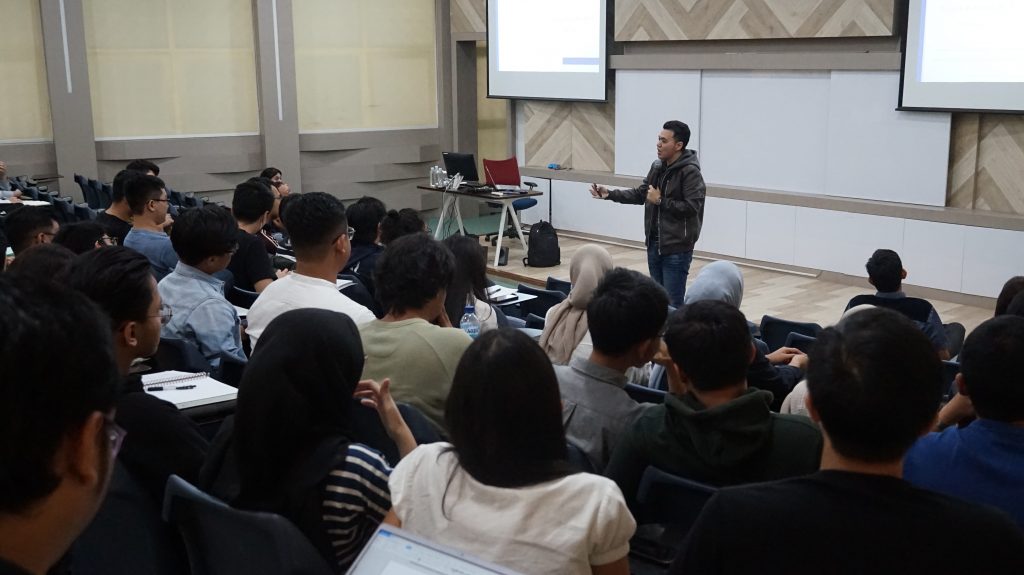
Indonesia has had the highest growth of the Composite Index Growth in the last 10 years. In this case, Indonesia has successfully beat Germany, Japan, USA, England, Hong Kong, and South Korea. This thing has shown that Indonesia still has a big market to penetrate, Hendry Wijaya said when he lectured in front of SBM students about How to be A Professional Investor on Wednesday, 12 February 2020.
According to Forbes, asset-allocation of the super rich person used to be put in the capital market. For instance, the richest ministers in Indonesia like Erick Thohir (who puts investments in securities up to 73 of total wealth), and Wishnutama Kusubandio (who puts investments in securities up to 69% of total wealth). In fact, stock investing has given the biggest return compared to the other financial instruments. Yet, it also needs to be understood that high returns also complement high risk.
Warren Buffet once said some rules in doing the stock investment. They are “Do not take yearly results too seriously. Instead, focus on four to five year averages” and “Never invest in anything that we do not understand.” This becomes a good things to learn: We have to focus on the long-term and make sure that our chosen stock has a good credibility.
How we can choose stocks? There are two ways to assess a good stock. They are fundamental and technical analysis. Fundamental analysis is a method of measuring a security’s intrinsic value by examining related economic and financial factors. Fundamental analysis uses public data to evaluate the value of a stock or any other type of security. “It is quite simple. We just need to take three indicators. First, net income growth has to always go up. Second is the Return on Equity (ROE) must be above 15%. Third, Price to Earning Ratio (PER) would be better if it get lower to the other stocks in that industry” he said.
Technical analysis is the forecasting of future financial price movements based on an examination of past price movements. Like weather forecasting, technical analysis does not result in absolute predictions about the future. Instead, technical analysis can help investors anticipate what is likely to happen to prices over time. Technical analysis uses a wide variety of charts that show price over time. Yet, actually we do not need to master all technical methods since it will make us even more confused in choosing the stocks. There are three methods which Hendry Wijaya recommend for this kind of analysis. First, the pattern and trend line (support resistance). Second is Japanese Candlestick (Psychology Market). Third is Momentum and Trending Indicators. Every technique actually has their own strength and weakness. Not all methods suit to be used in every condition.

In overall view, the market has two conditions. They are sideways and trending. A sideways trend is the horizontal price movement of a stock between resistance and support levels that occurs when the forces of supply and demand are balanced while a price series that continues to continually close either higher or lower is said to be trending. Methods like Relative Strength Index (RSI) and Stochastic are likely better to use in sideways movement while moving average is better to use in trending movement.
“There is also my favorite tool in this technical analysis. I used to call this method as the amphibian method since it is good to use whether in sideways and trending stock movement. It is Fibonacci retracement which is created by taking two extreme points (usually a major peak and trough) on a stock chart and dividing the vertical distance by the key Fibonacci ratios” closed his lecture.


